AI-POWERED CO₂ Tracker
EcoTrack is a real-time carbon emission tracking app that provides users with live insights into their carbon footprint based on daily activities
Product Designer
Product Manager

A few months ago, while moving out of my apartment, I was struck by the sheer amount of hidden waste—expired food, half-used products, forgotten items—all tossed into overflowing trash piles. A joke from my roommate about our “carbon footprints” lingered with me, prompting a deep dive into carbon emissions and how we track them. I discovered most apps relied on long forms, manual inputs, or rough estimates—making sustainability feel like a chore. That moment sparked a question I couldn’t shake: What if tracking your carbon footprint was so effortless, people actually did it?
Solution


1) UX Research
💡 Why did I do this?
Before designing, I explored existing apps like Capture, Commons, Earth Hero, and Aerial to understand what worked and what didn’t. I wanted to solve real user problems—not reinvent the wheel or add to the clutter.

🔹 Categories Analyzed:
I analyzed five key areas: data accuracy, automation, scope, privacy, and user engagement. This helped me uncover where current apps fall short and what users actually need.
🔹 Insights and Learnings:

User Research: Interviews
I used Google Forms to reach out to user participants on social media through platforms like facebook groups, discord communities, linkedIn UX research groups etc.

💡 Why did I do this?
User interviews revealed how people truly perceive their carbon footprint and the gaps in their daily sustainability efforts. These insights became the backbone of EcoTrack’s user-focused design and features
🔹 Insights and Learnings


Quotes from Interviews
User
User
User
💡 Why did I do this?
By creating proto-personas from secondary research, I clarified user motivations, behaviors, and gaps. This early affinity mapping grounded EcoTrack’s direction in real needs, not assumptions.

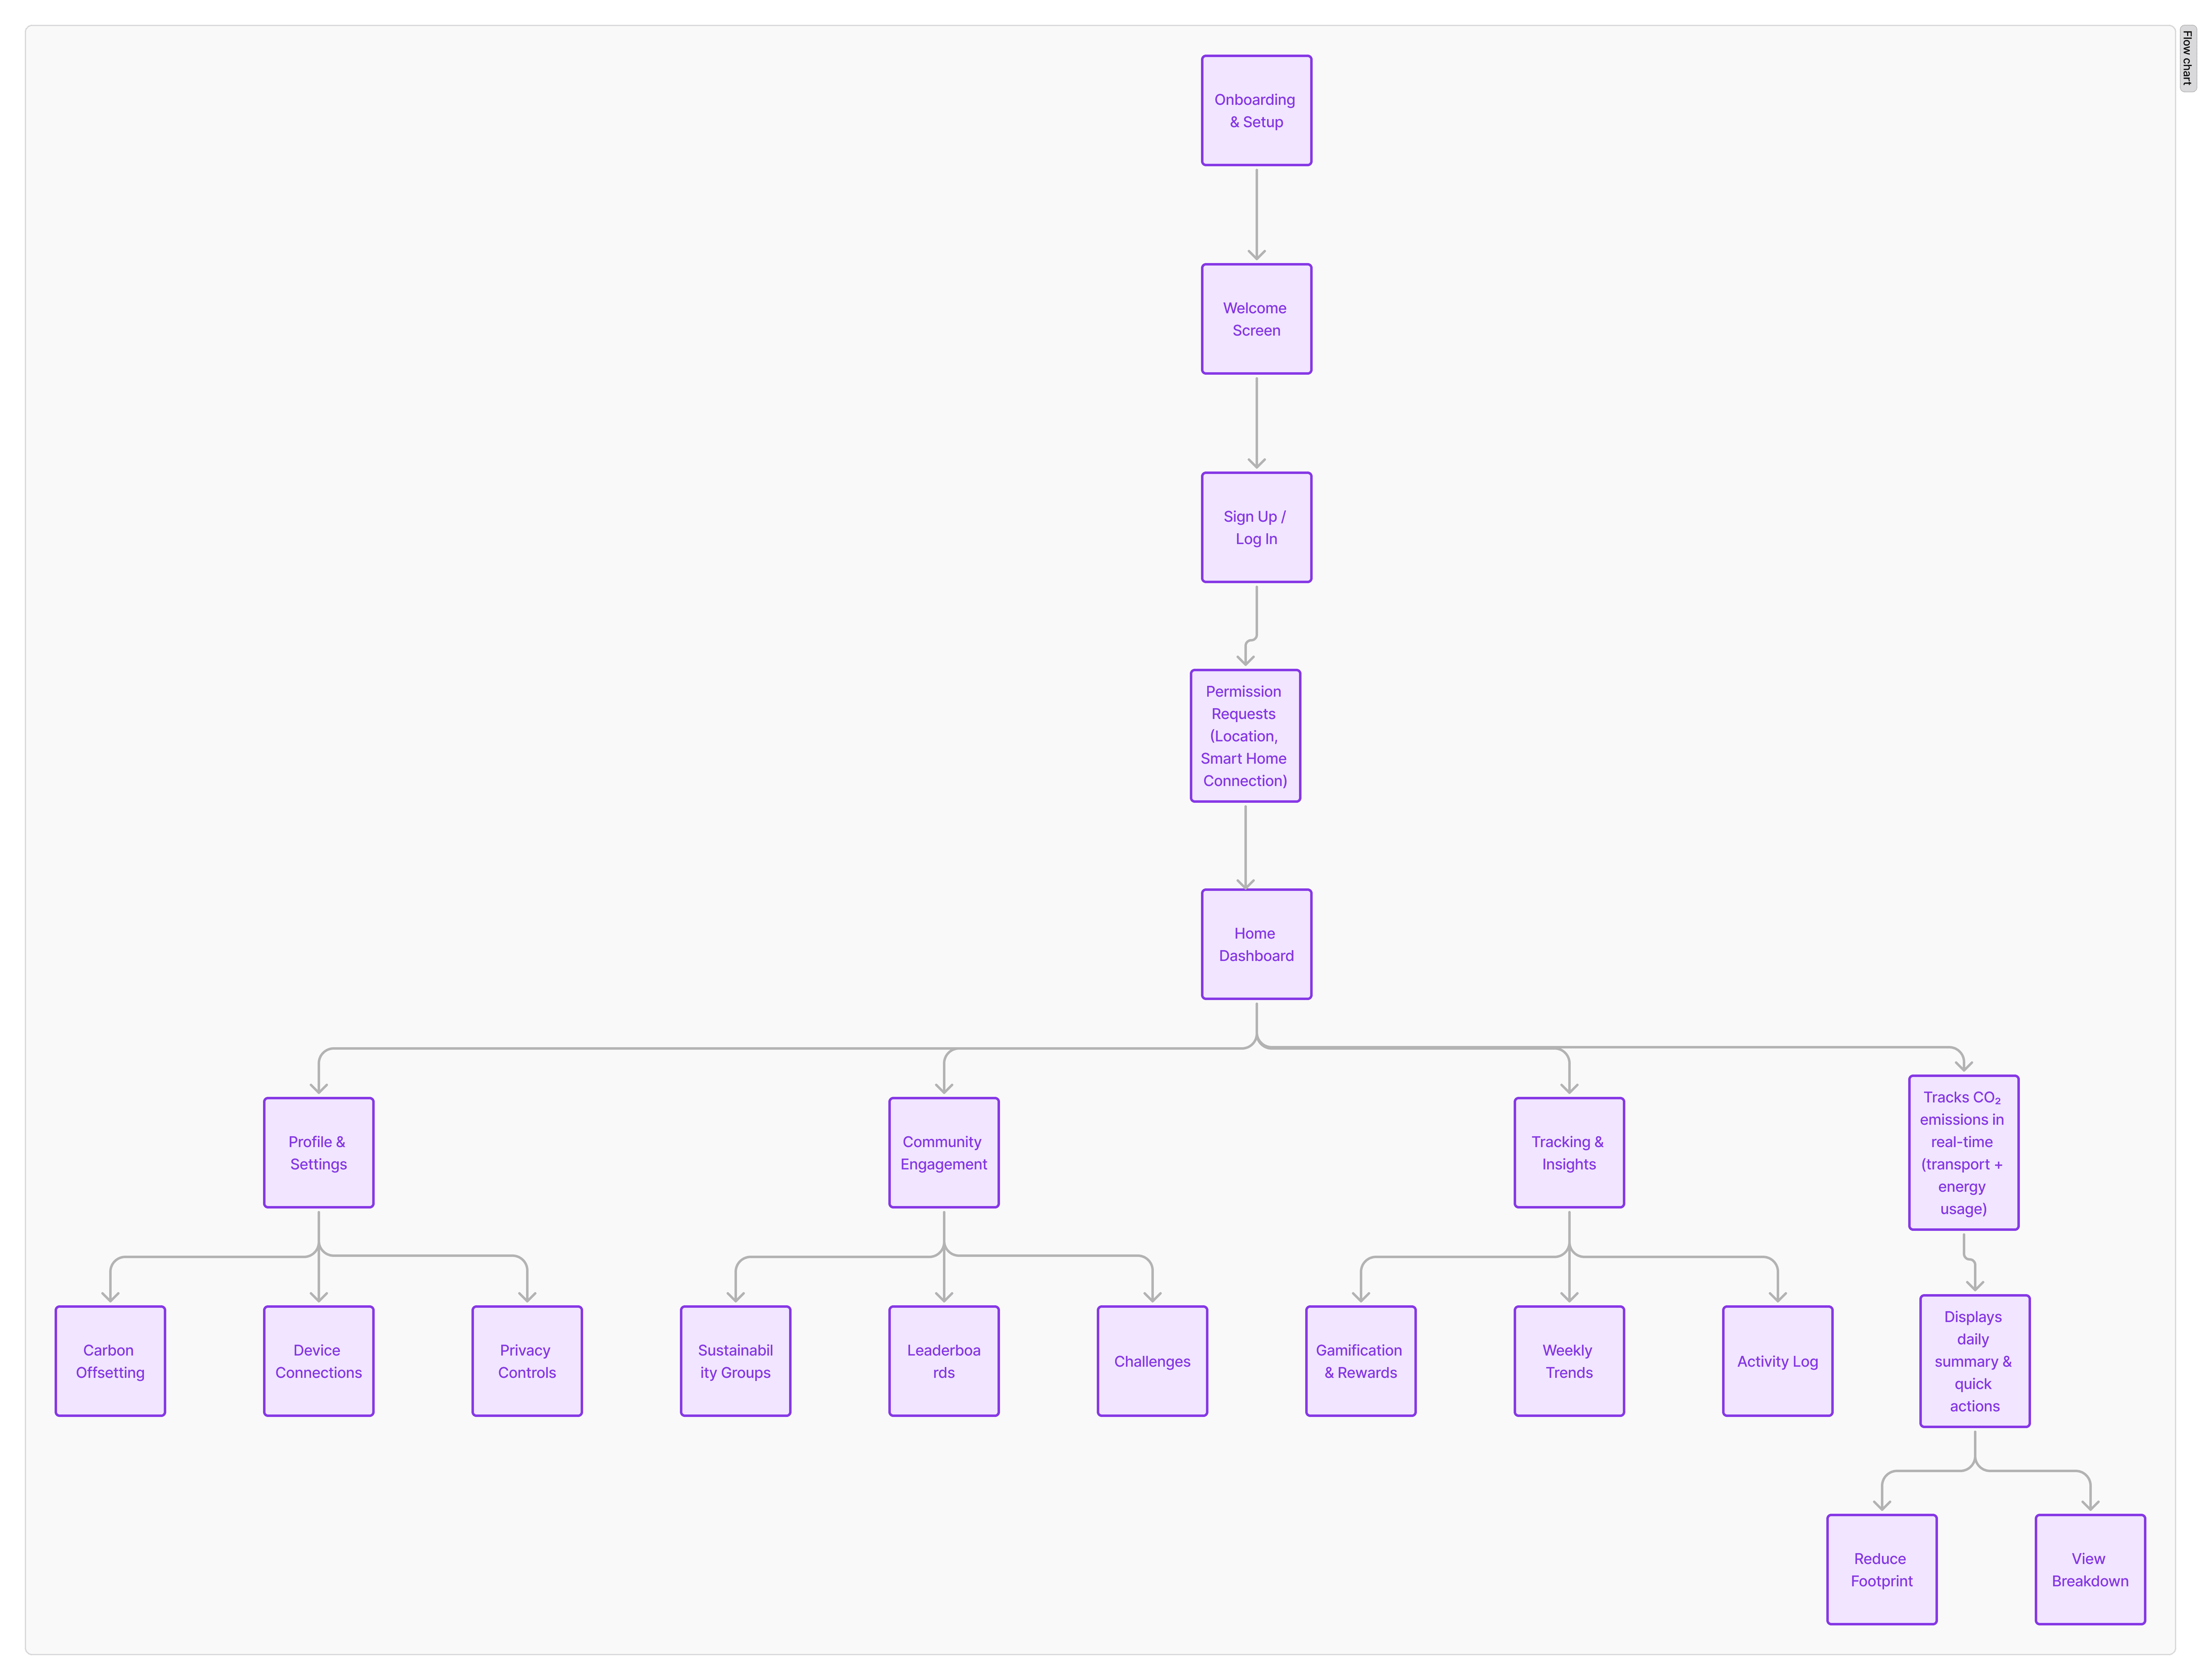
Conceptualizing User Flow
Once I zeroed down to the solution for the real-time carbon footprint tracking, I needed a starting point to start shaping up my ideas. I put down a user flow as the first step towards execution:
Next I started putting the conceptualized user flow into rough sketches. The sketches were a part of my brainstorming to purely to put my thoughts on paper


Low-Fidelity - Iteration 1
Figma Link to first iteration wireframe
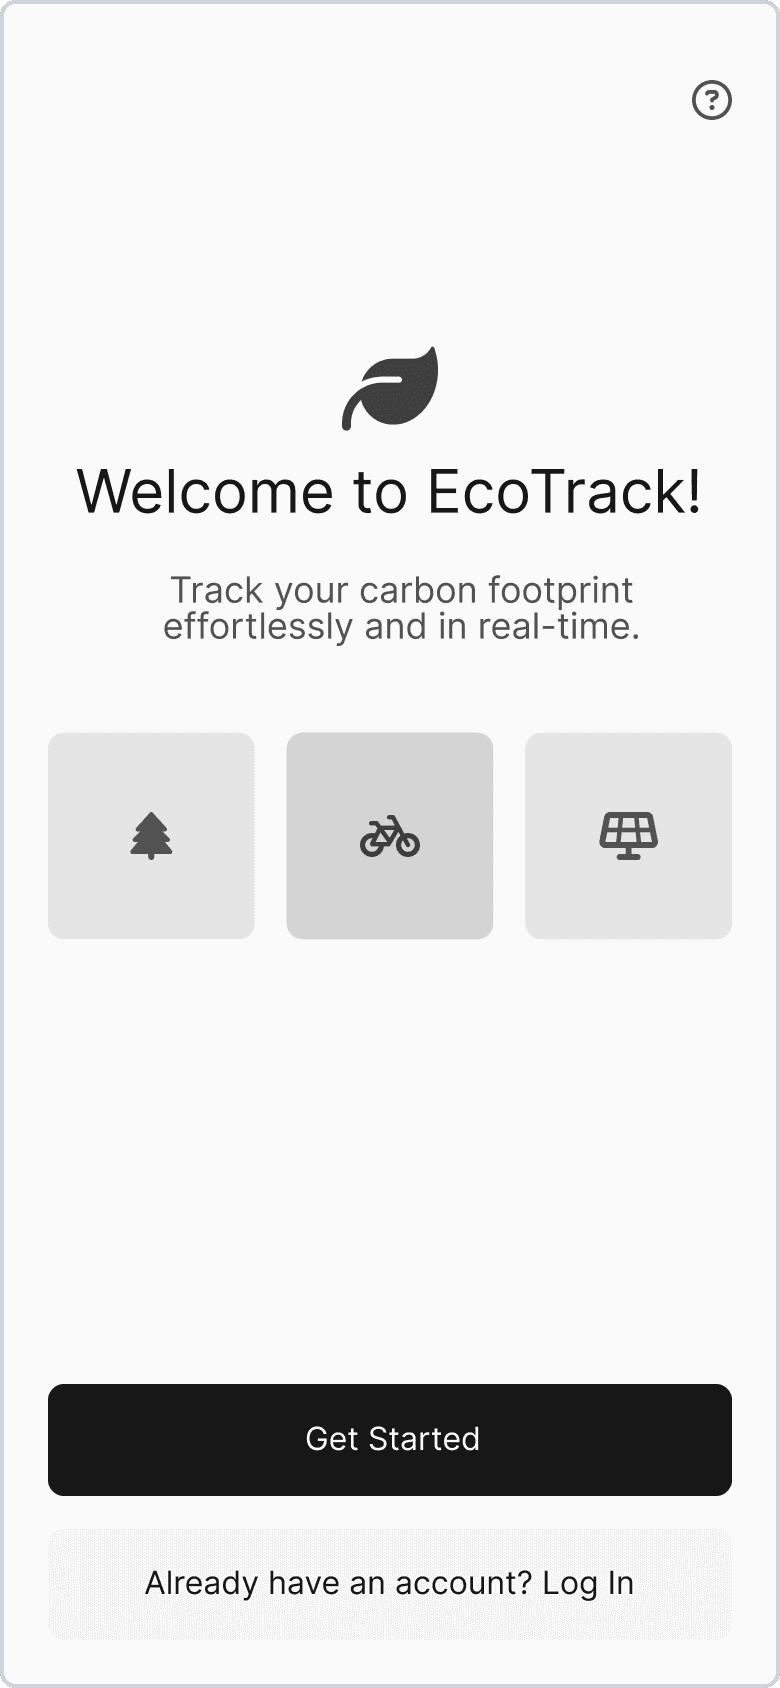
This version had the basics right, but users felt a bit lost — no welcome, unclear icons, and too much info at once. It wasn’t obvious where to start, so people missed key features like tracking. Usability testing made those gaps clear, helping shape the cleaner, simpler version that followed.
Usability Testing
Figma link to usability testing dashboard
🔹 Insights and Learnings:
What worked
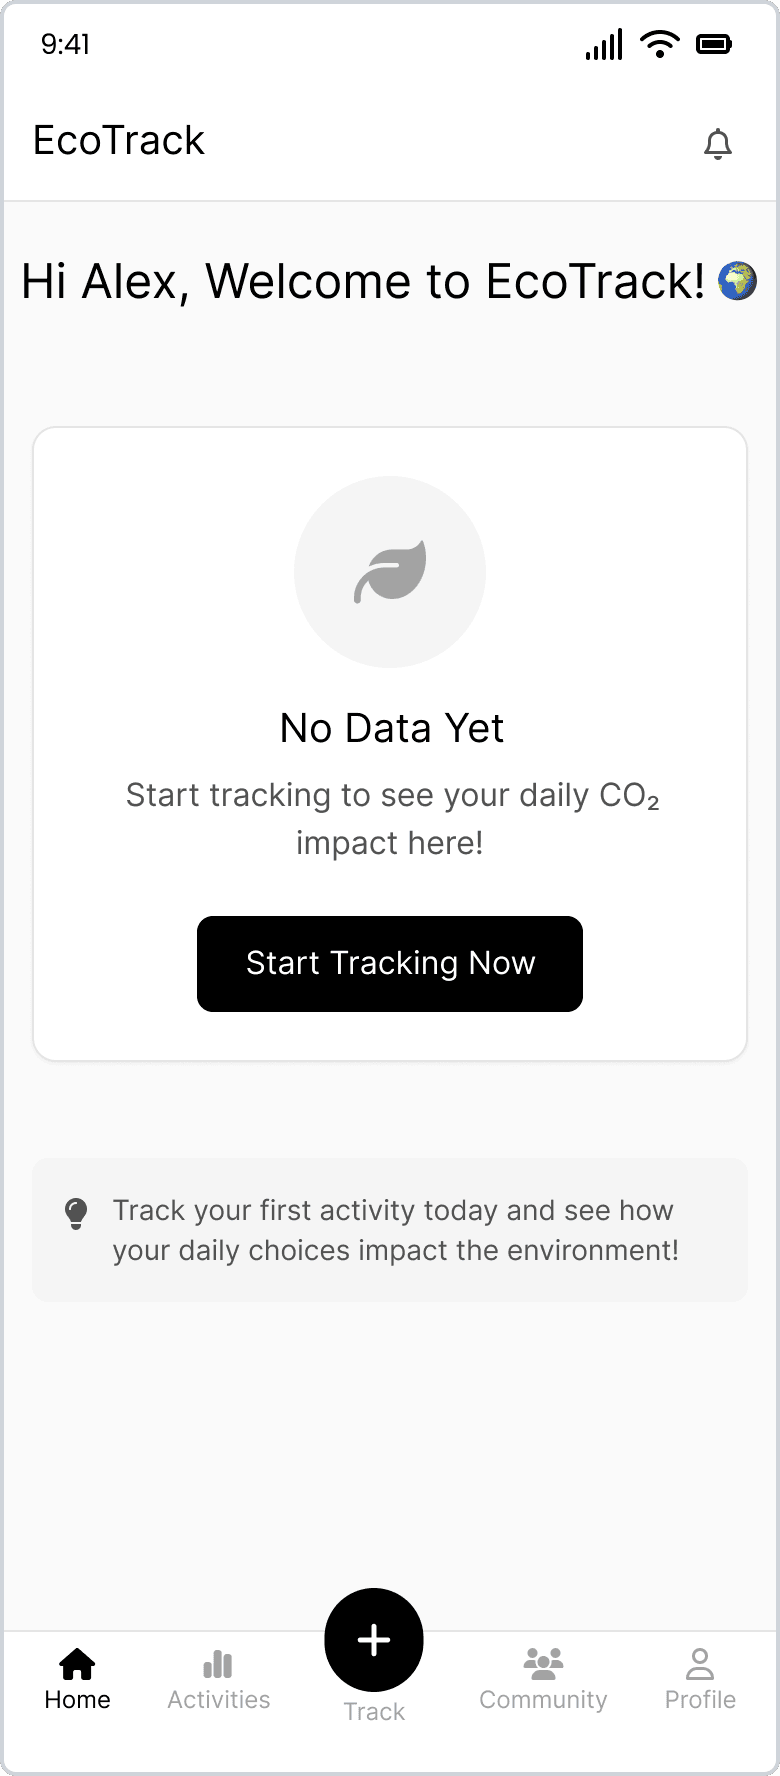
1. Onboarding flowed really well
2. Tracking starts automatically and users can customize it
3. Users felt engaged and intrigued while navigating the app
What didn’t work
1. Users didn’t navigate to settings intuitively at the first time
2. The graphs on dashboard weren’t as expected
Recommendations
1. Track button placement
2. Labels for Nav Bar
3. Cleaner and organized dashboard
Low-Fidelity - Iteration 2
The second iteration, was a little refined one or lets say intermediate stage before I turned to high fidelity designs. By this time, I had finalized my font, button shape components, CTAs and logo

Painpoint:
"I had to enter, like, what transport I took and how much I spent on stuff. I tried adding a few things, but it was just too much work"
Solution:
Users can track their carbon footprint in real-time without manually inputting data
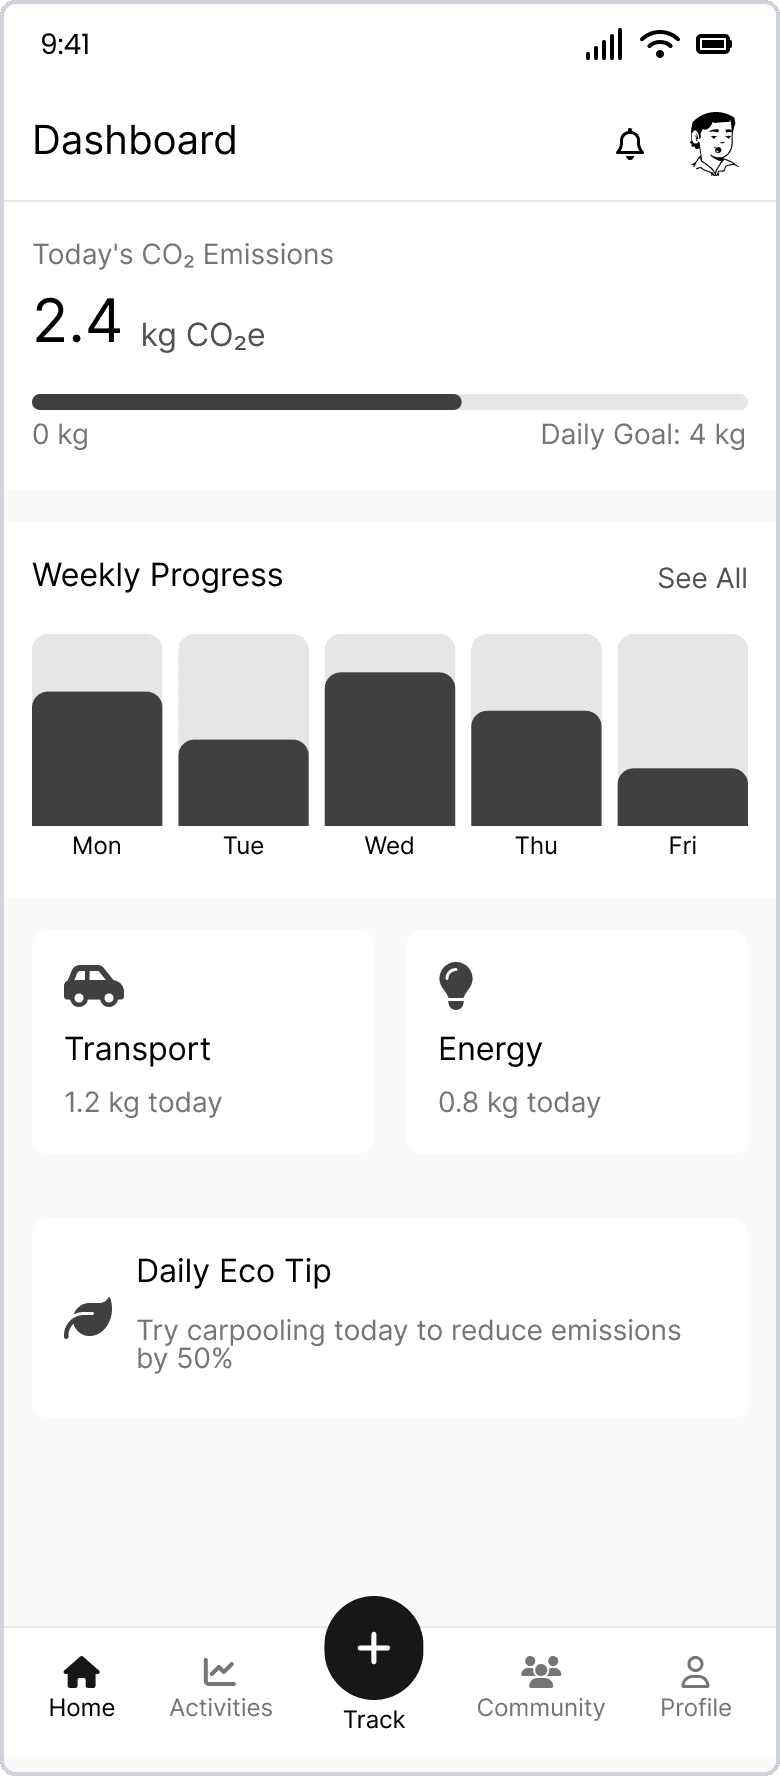
⚡️User friendly CO2 Emissions display
Painpoint:
"There were all these numbers and charts and it was just difficult to understand. I mean, I get that it’s about emissions, but I never understood what they really meant"
Solution:
Users can easily understand the day-to-day impact of their activities through simplified and minimal numbers display
Holistic Tracking of Home Energy and Food Consumption
Painpoint:
"I mainly struggled to keep track of my usage of home appliances"
Solution:
Users can track their energy and food consumption in real-time
Smart Tracking Mode Selection
Painpoint:
"I don’t want an app that kills my battery while tracking in the background"
Solution:
Users can choose between Smart Mode (motion-based GPS) or Always-On (high accuracy) in settings. A Low Power Mode auto-pauses GPS when battery drops below 20%, with a grayed-out GPS icon for clarity
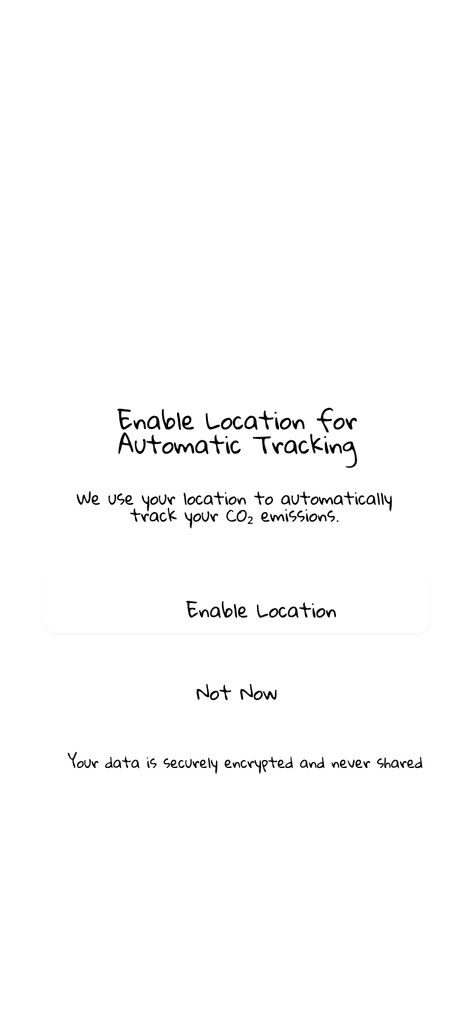
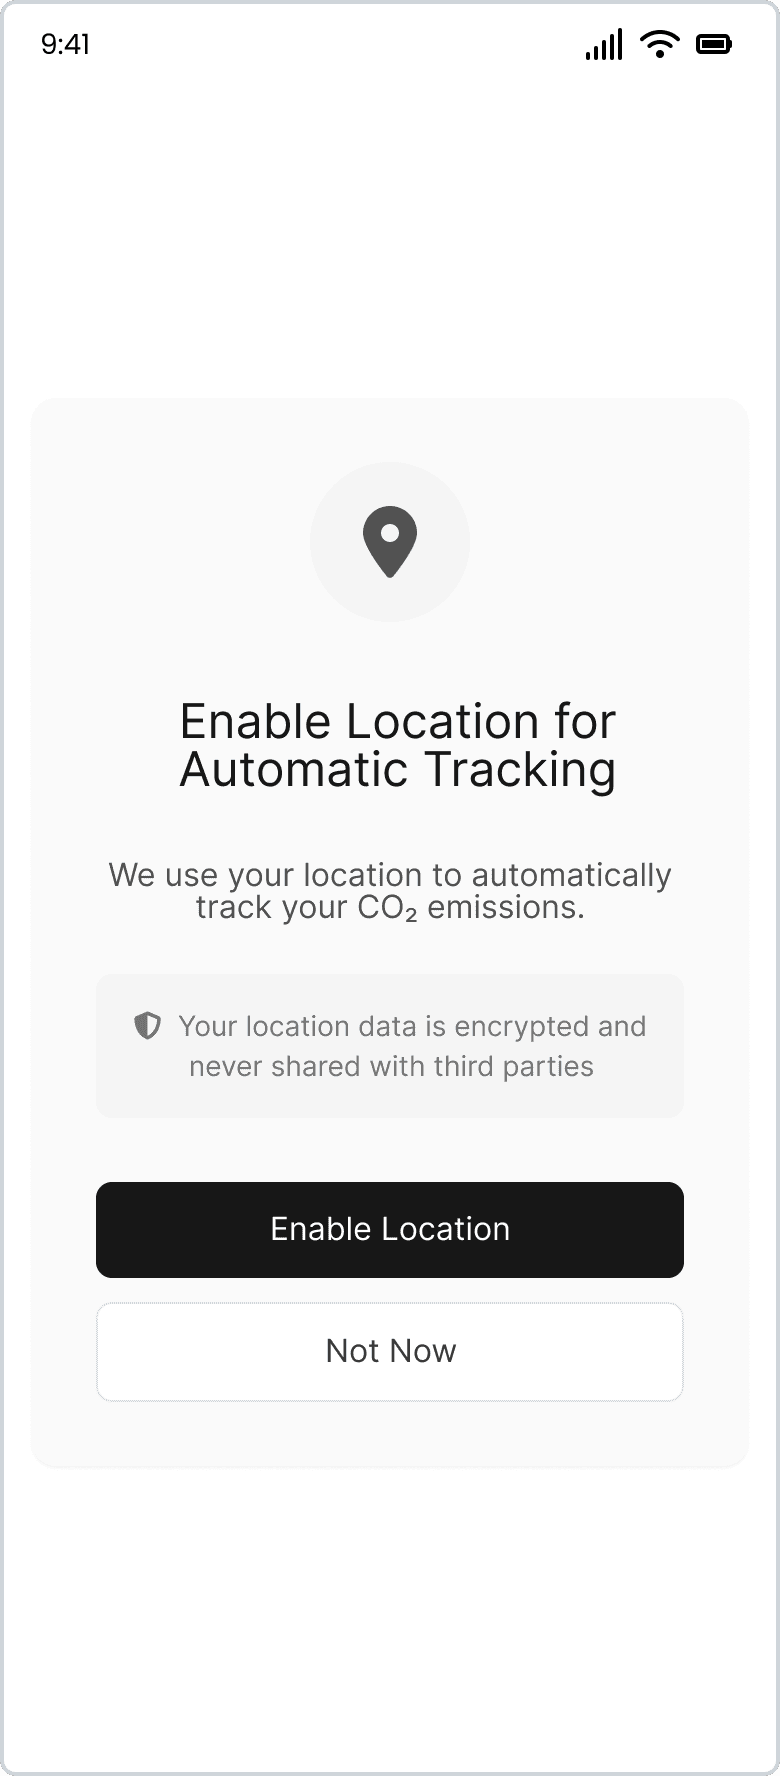
Privacy Concerns Over Location Tracking
Painpoint:
"I don’t want my exact location constantly being tracked and stored"
Solution:
Anonymous Mode lets users track emissions without storing location data, ensuring privacy while maintaining functionality. This fosters trust and peace of mind, reducing anxiety about tracking and data misuse.
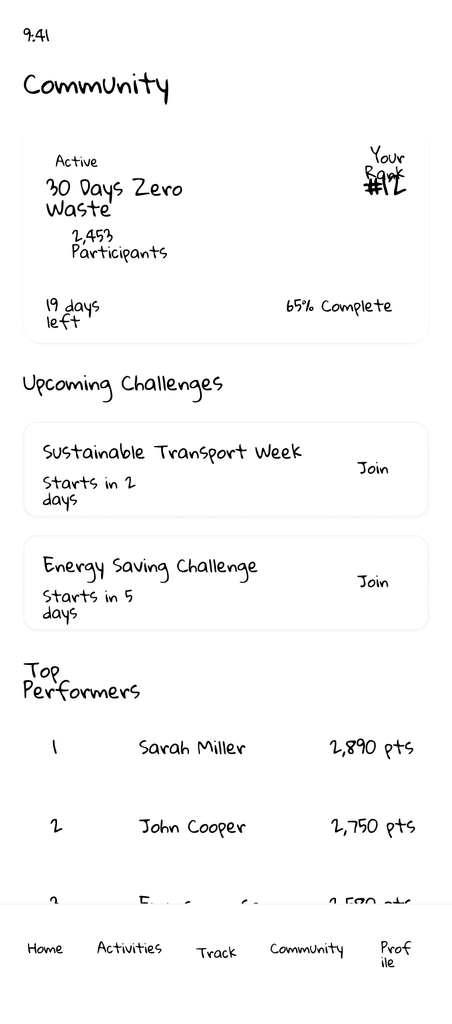
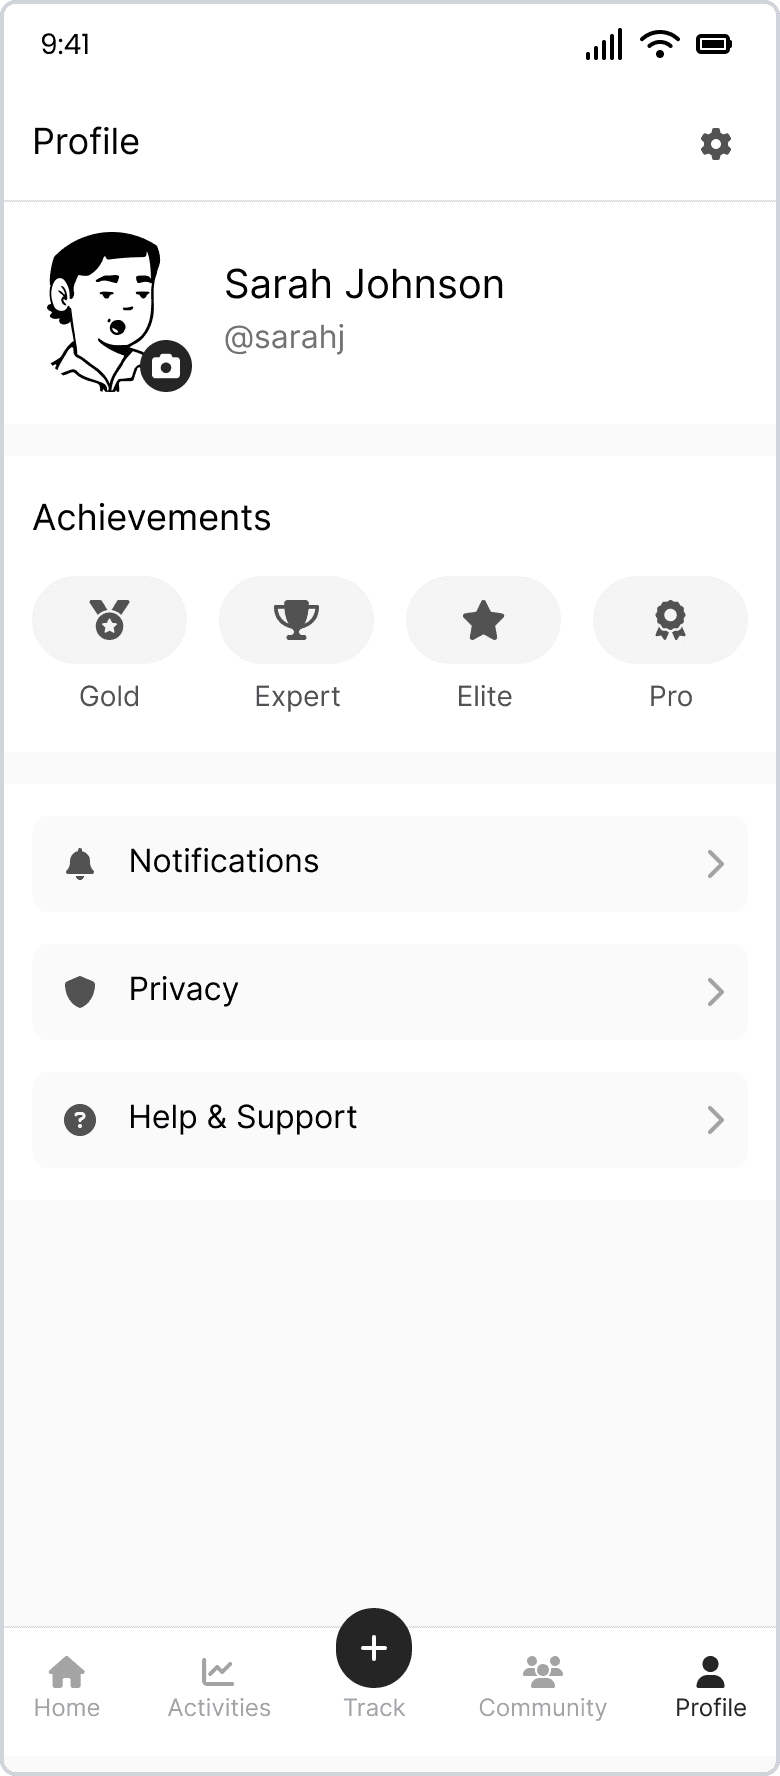
🏆Activities, Community & Rewards
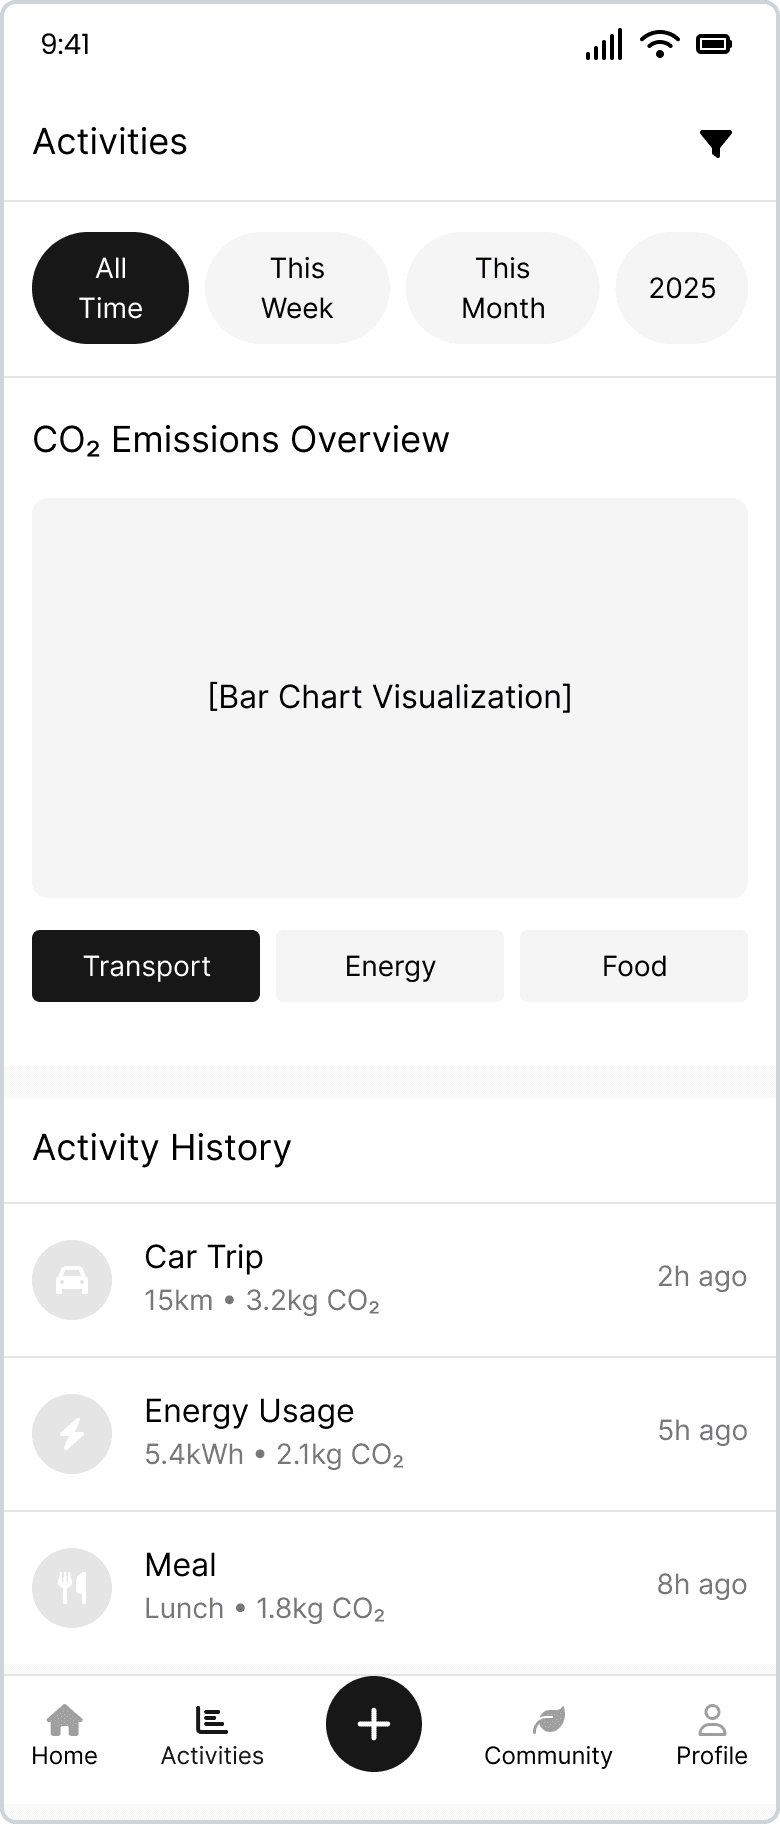
Screens:
Activity History · Analytics Overview · Community Challenges · Personal Goals & Rewards
Purpose:
This section offers users a complete journey—from understanding their carbon footprint to taking action and staying motivated
Users can explore their historical data and visualize impact through insightful analytics.
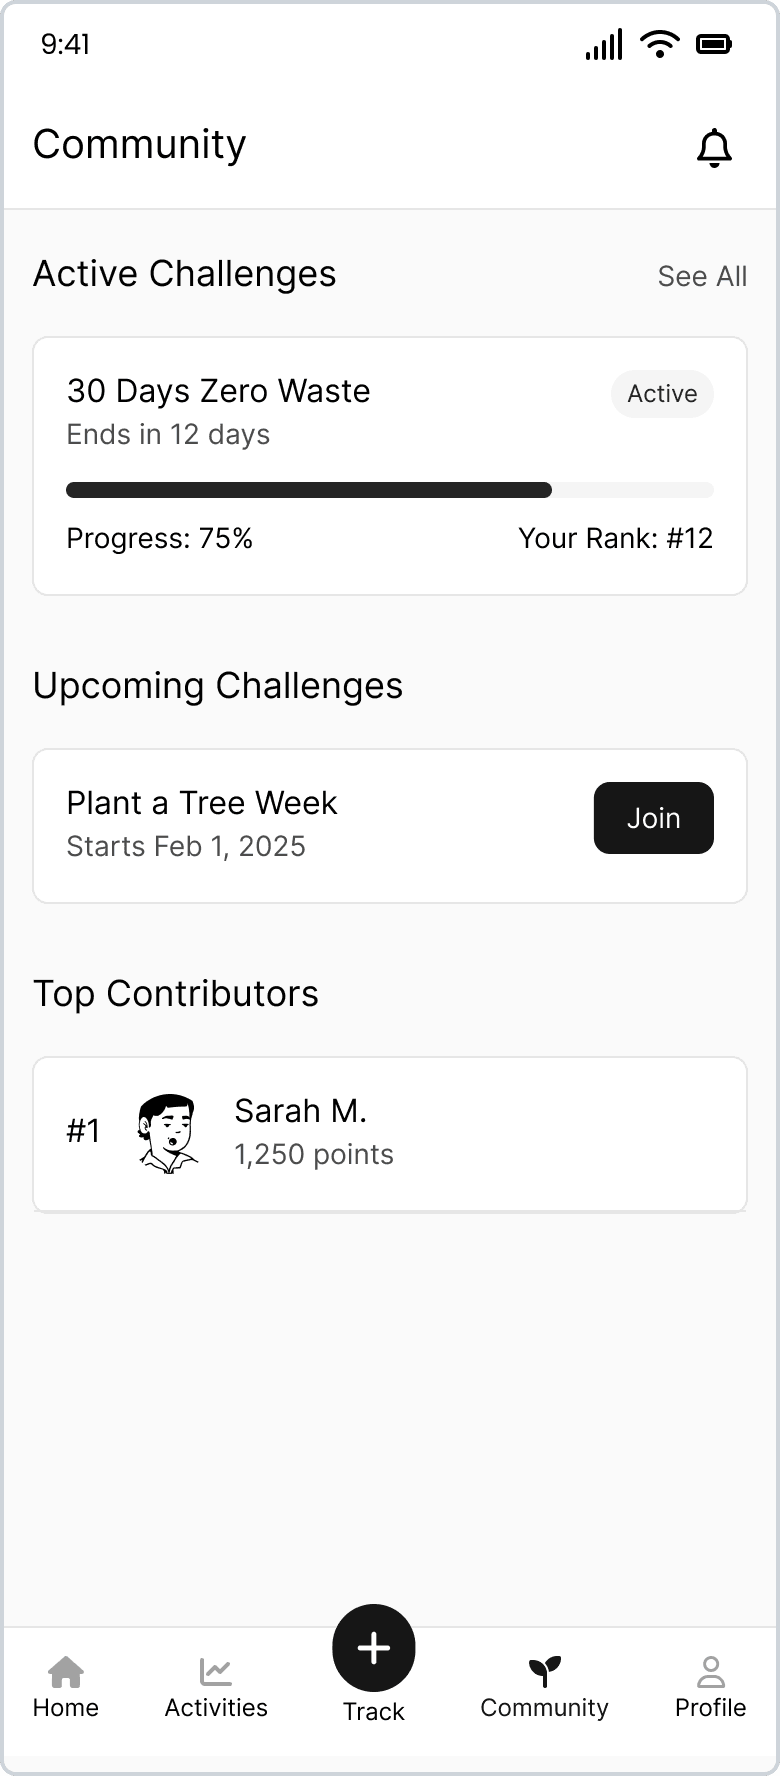
The Community page, inspired by 60% of user feedback, boosts accountability and engagement via social challenges.
The Goals & Rewards page uses gamification to help users set personal sustainability goals and earn rewards—turning small actions into long-term habits.


Simplicity is Key for User Adoption
Users prefer passive tracking over manual input. Reducing friction in onboarding & data entry boosts engagement.
Clear, Actionable Insights Over Raw Data
Users don’t connect with abstract CO₂ numbers—contextual comparisons (e.g., “You saved emissions equal to 10km of driving”) enhance understanding.
Gamification & Community Increase Retention
Challenges, badges, and leaderboards make sustainability engaging. Social comparison and motivation help drive behavior change.
Trust & Transparency in Tracking
Users fear intrusive tracking. A privacy-first approach (on-device processing, opt-in tracking controls) increases confidence.
Personalization Improves Relevance
Different users have different goals (students, professionals, families). Custom recommendations & adaptive UI create a better user experience
—>
Back to Top